A holistic approch
To sustainability.
ECONOMIC PERFORMANCE

GRI Standards
| GRI 201: Economic Performance | Sections/Comments | |
|---|---|---|
| GRI 103-1 | Management approach: Explanation of the material topic and its boundary | |
| GRI 103-2 | Management approach: The management approach and its components | |
| GRI 103-3 | Management approach: Evaluation of the management approach | |
| GRI 201-1 | Direct economic value generated and distributed | Net revenue: ₹ 7,496.71 Crores Profit after Tax: ₹ 1,021.24 Crores |
| GRI 201-2 | Financial implications and other risks and opportunities due to climate change | In response to the pressing environmental challenge of climate change, KNPL has adopted the Task Force on Climate-related Financial Disclosures (TCFD) framework in FY 2022-23 to assess and quantify its risks and opportunities. We have integrated the identified risks with our Enterprise Risk Management strategy. |
| GRI 201-3 | Defined benefit plan obligations and other retirement plans | Employee Benefits (Note 32, 39) |
| GRI 201-4 | Financial assistance received from government | Company received no financial assistance from government |
Financial Performance

(₹ in Crores)
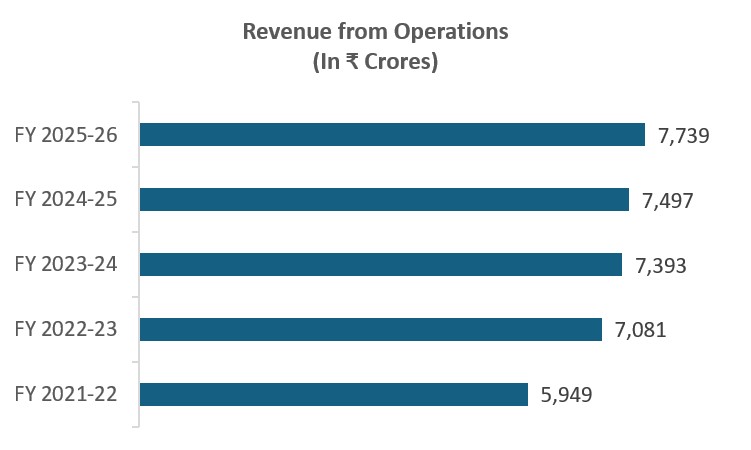
Revenue from operations for the year aggregated to ₹ 7,739.23 Crores, compared to ₹ 7,496.71 Crores in the previous year, reflecting 3.2% growth. Although average crude oil prices declined during the year, currency depreciation partially offset the impact. Consequently, overall raw material prices remained largely stable throughout the year.
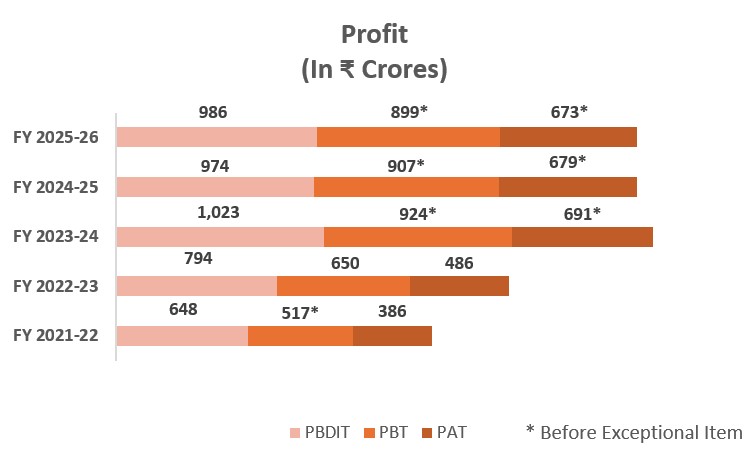
Meanwhile, we continued our efforts to control overheads, with all departments contributing positively towards this objective. PBDIT for the year stood at ₹ 986.22 Crores, compared to ₹ 974.13 Crores in the previous year, reflecting 1.2% growth. In addition, other income increased to ₹ 152.46 Crores from ₹ 142.06 Crores recorded in the previous year.
PBT for the year stood at ₹ 898.91 Crores, marginally lower than ₹ 907.42 Crores reported in the previous year before exceptional items, reflecting a degrowth of 0.9%. PAT declined to ₹ 619.85 Crores from ₹ 1,021.24 Crores in the previous year, marking a degrowth of 39.3%. Return on net worth, excluding exceptional items, stood at 10.3% compared to 11.3% in the previous year.
During the year, KNPL did not accept any deposits covered under Chapter V of the Companies Act, 2013. Furthermore, no material orders were passed by regulators, courts, or tribunals that could affect our going concern status or future operations. There was also no change in the nature of our business during the year. Additionally, no material changes or commitments affecting our financial position occurred between the end of the financial year and the date of this report.
| Particulars | FY 2025-26 | FY 2024-25 |
|---|---|---|
| Revenue from Operations | 7,739.23 | 7,496.71 |
| Profit before Depreciation, Interest, Exceptional Item, and Tax (PBDIT) | 986.22 | 974.13 |
| Less: Depreciation and Amortisation | 221.36 | 193.68 |
| Profit Before Interest, Exceptional Item, and Tax (Operating Profit) | 764.86 | 780.45 |
| Less: Interest | 18.41 | 15.09 |
| Add: Other Income | 152.46 | 142.06 |
| Profit Before Exceptional Item and Tax | 898.91 | 907.42 |
| Add: Exceptional Item | (60.7) | 479.19 |
| Profit Before Tax (PBT) | 838.21 | 1,386.61 |
| Less: Tax Expenses | 218.36 | 365.37 |
| Profit after Tax | 619.85 | 1,021.24 |
| Other Comprehensive Income | 6.74 | (3.46) |
| Total Comprehensive Income for the Year | 626.59 | 1,017.78 |
Way Forward

At KNPL, the agenda and preparations for the upcoming fiscal year are meticulously laid out at the start of the year. This comprehensive process involves formulating and developing a detailed yearly business plan encompassing all aspects of our operations and strategies. A detailed annual budget is prepared by the Management Committee, which includes functional heads, Managing Director and then approved by the Board of Directors, based on the annual business plan and macro environment, including currency value, raw material costs and energy costs, among other things. The functional heads and the Management Committee review the budget regularly. The Company monitors the budget using several IT platforms and has devised multiple system checks to keep it under control.
Revenue from Operations (₹ in Crores)
PROFIT (₹ in Crores)
PROFITABILITY (%)
Profitability ratios are based on Net Sales
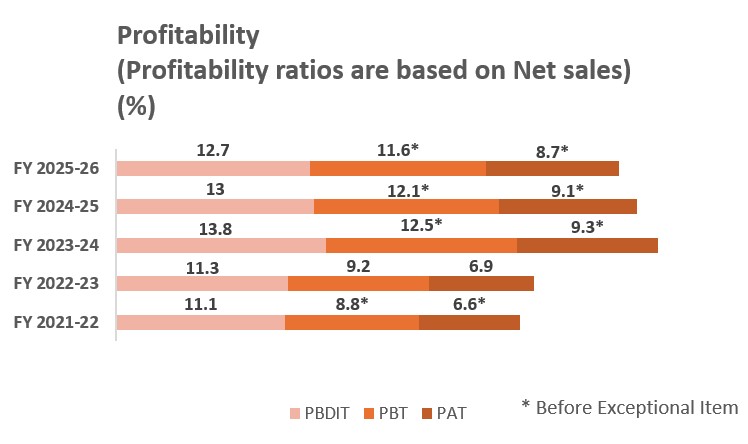
*Before exceptional item
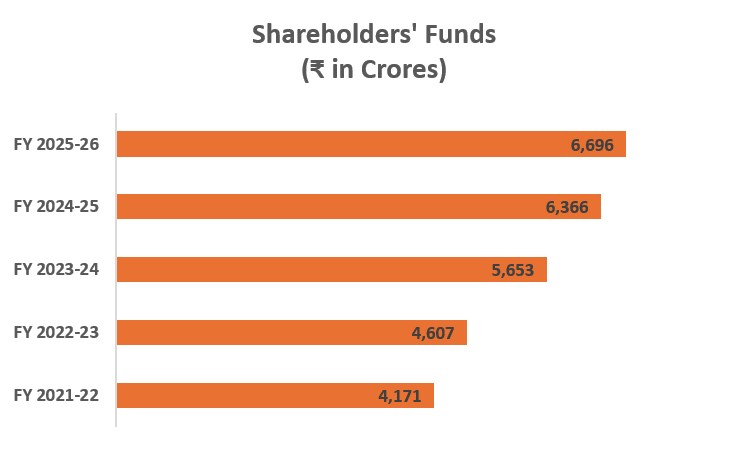
SHAREHODERS’ FUNDS (₹ in Crores)
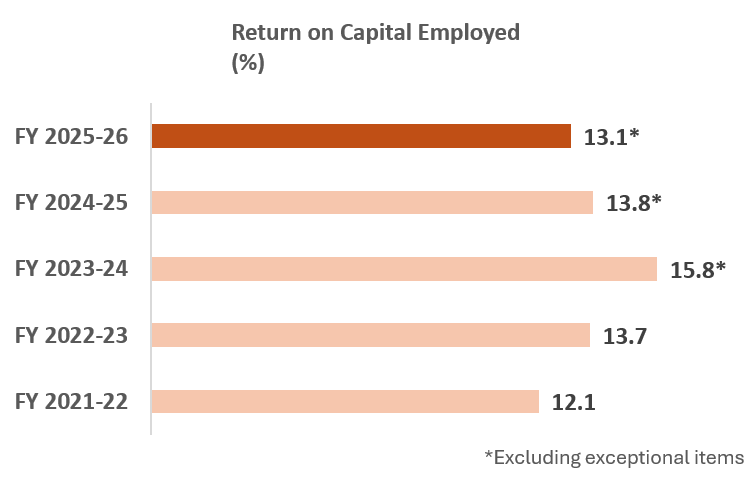
RETURN ON CAPITAL EMPLOYED (%)
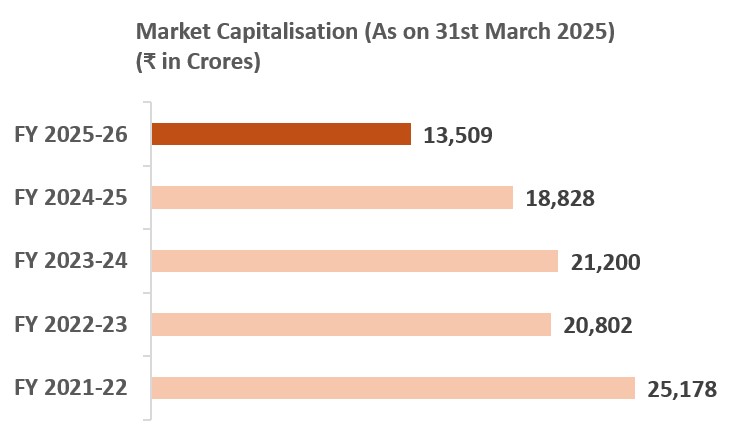
MARKET CAPITALISATION as on 31st March (₹ in Crores)
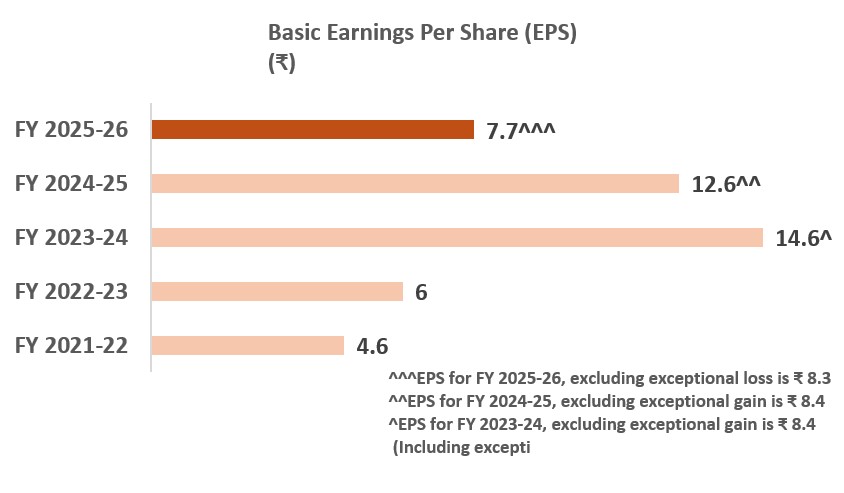
EARNINGS PER SHARE (EPS) (₹)
DIVIDEND (%)

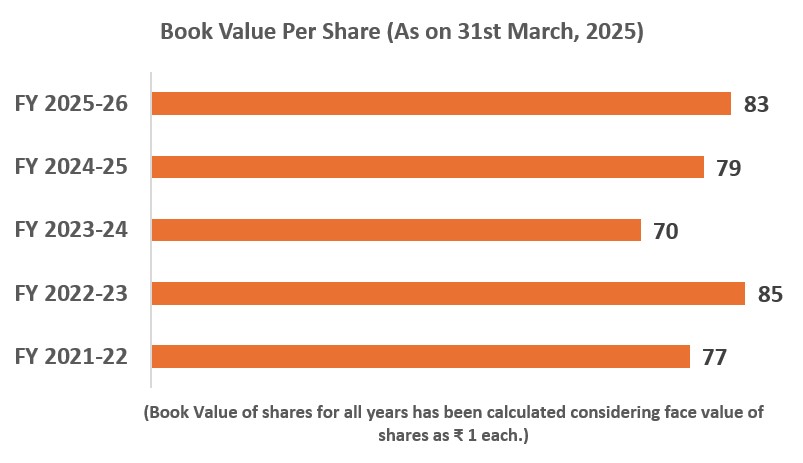
BOOK VALUE PER SHARE as on 31st March (₹)